Red Flags in Odometer Logs: Detecting Mileage Tampering in Fleet Analytics

The commercial vehicle market operates on precision, where every mile recorded on an odometer translates directly to asset depreciation, engine wear, and calculated residual value. For fleet buyers, logistics companies, and commercial dealerships, mileage metrics are the primary variable in determining procurement cost. However, digital odometer manipulation has evolved from simple mechanical tampering into sophisticated software manipulation, creating multi-million dollar liabilities across the used commercial asset market.
While altering a digital instrument cluster using basic handheld diagnostic tools takes only minutes, scrubbing historical digital footprints is nearly impossible. Commercial assets generate vast amounts of telemetry and administrative data throughout their operational lifecycles. By analyzing data patterns across state registries, maintenance networks, and diagnostic modules, analysts and procurement officers can systematically identify mileage tampering before committing capital.
Key Anomaly Patterns in Mileage Telemetry
A vehicle’s history is logged continuously across multiple independent databases. Every annual inspection, emissions test, routine service check, and auction entry creates a timestamped record. When an odometer is rolled back prior to resale, it creates structural anomalies within these chronological datasets.
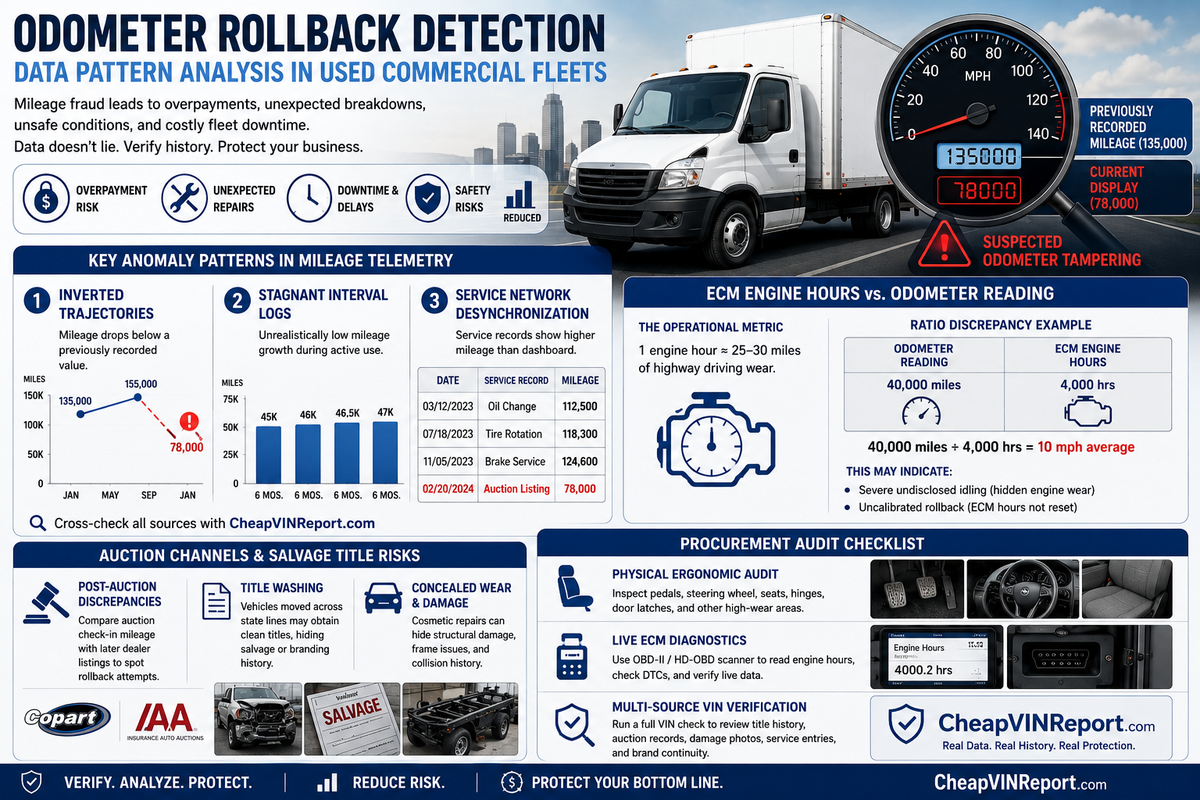
- Inverted Trajectories: The most definitive indicator of tampering is a non-linear mileage drop. Standard vehicle usage presents a strictly positive trajectory over time. An inverted trajectory occurs when a newly logged data point shows lower cumulative mileage than a previously documented historical entry—such as a delivery van logged at 135,000 miles during a routine fleet service, appearing four months later at auction with 78,000 miles on the dashboard.
- Stagnant Interval Logs: Commercial assets exist to generate operational revenue and rarely sit idle for extended periods without documented maintenance or seasonal storage. Suspiciously flat mileage progression across sequential 6-to-12-month reporting windows—despite continuous registration and tax renewals—frequently points to the use of active hardware mileage blockers.
- Service Network Desynchronization: Commercial fleets utilize national service chains and internal maintenance software that log precise mileage during every oil change, tire replacement, or brake service. Fraudsters often reset cluster displays prior to wholesale liquidation, but their figures routinely conflict with higher mileage benchmarks already permanently logged in private service networks.
To flag non-linear drops and cross-check chronological title filings against historical service entries, fleet auditors rely on centralized verification tools like CheapVINReport to validate raw vehicle data before purchase.
Diagnostic Verification: ECM Engine Hours vs. Odometer Reading
Evaluating an asset's true operational wear requires auditing data beyond the primary dashboard display. Modern commercial vehicles feature an onboard Engine Control Module (ECM) that logs total Engine Operating Hours independently of the instrument cluster.
In standard commercial driving applications, one engine hour represents approximately 25 to 30 miles of highway operational wear. While urban delivery routes with frequent idling lower this average, extreme mathematical mismatches reveal underlying issues.
For instance, if an ECM diagnostic read-out reports 4,000 total engine hours on a commercial van displaying only 40,000 miles on the cluster, the calculated average operational speed is just 10 miles per hour. This discrepancy indicates one of two critical risks:
- Severe Undisclosed Idling: The vehicle experienced extreme idle time, causing significant internal engine carbon buildup, oil dilution, and hidden mechanical wear despite the low odometer reading.
- Uncalibrated Rollback: The seller reprogrammed the digital cluster display to show lower mileage but failed to clear or recalibrate the deep-level ECM hour counter.
Auction Channels and Salvage Title Risks
When commercial fleets decommission aging inventory, assets frequently enter wholesale auction channels such as Copart or IAAI. The liquidation phase between auction release and secondary dealer relisting represents a high-risk window for telemetry alteration.
- Post-Auction Discrepancies: Comparing entry mileage recorded by the auction house upon check-in against secondary dealer sales listings frequently uncovers recent rollbacks.
- Title Washing: Transporting vehicles carrying "Salvage," "Rebuilt," or "Odometer Discrepancy" status across state lines allows bad actors to exploit administrative delays between state registries to obtain clean titles.
- Concealed Wear and Damage: Cosmetic repairs often conceal structural stress, frame misalignment, and prior collision damage, making heavily used fleet assets appear clean to unsuspecting buyers.
Procurement Audit Checklist
Mitigating risk during asset acquisition requires integrating physical inspection markers with thorough data validation.
- Physical Ergonomic Audit: Check high-touch surfaces for wear inconsistent with the cluster reading. Worn rubber pedal pads, smooth steering wheel rims, sagged driver seat bolsters, and loose door latches typically signal extensive usage regardless of low reported miles.
- Live ECM Diagnostics: Connect a OBD-II or HD-OBD scanner to pull live engine operating hours and check if diagnostic trouble codes (DTCs) have been recently wiped.
- Multi-Source VIN Verification: Run complete history audits via CheapVINReport to verify chronological title trends, review past auction damage photos, and ensure title brand continuity.
By enforcing rigorous data auditing and cross-referencing telemetry touchpoints, fleet managers and buyers can isolate fraudulent inventory, protect operational capital, and maintain fleet safety standards.